MS data management
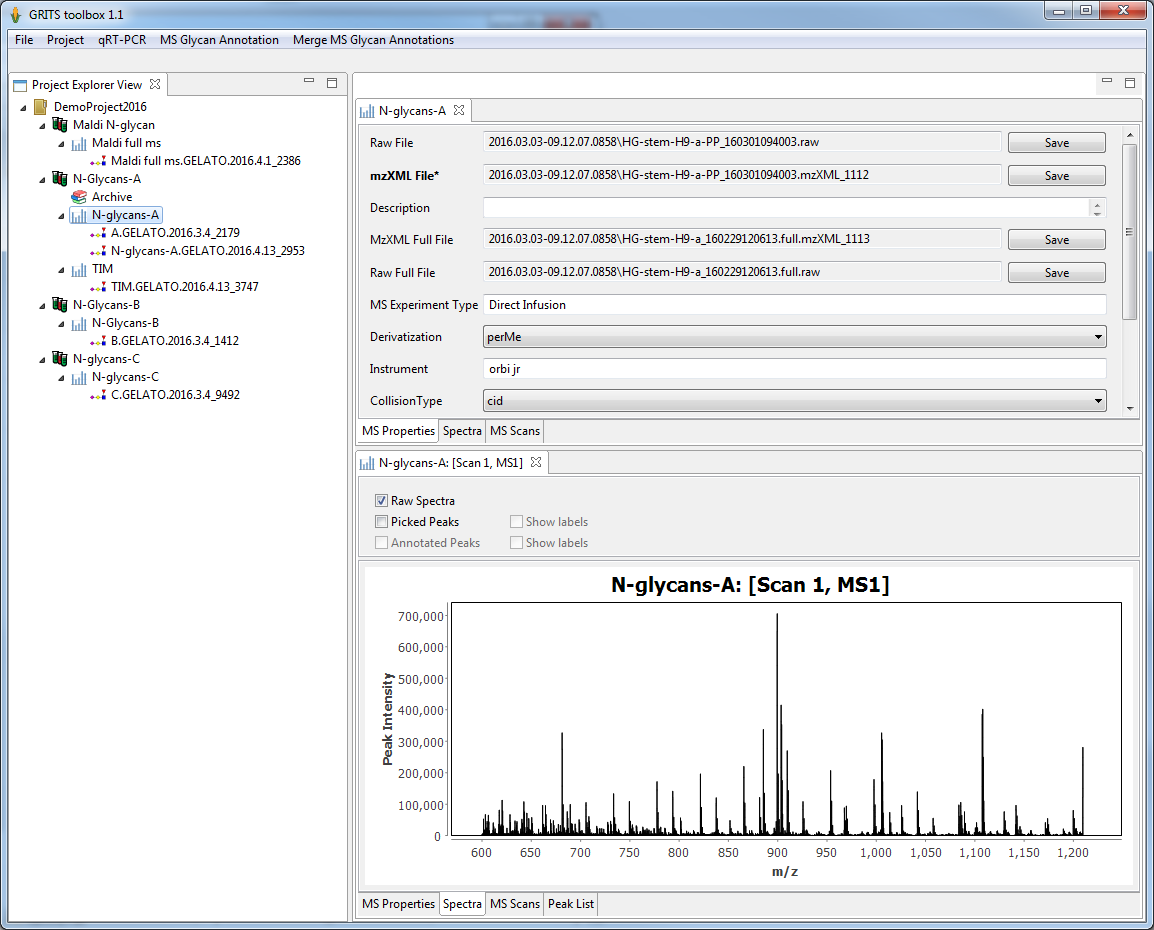
MS data from different types of experiments(e.g. MS profile, direct infusion MS/MS, LC/MS/MS, Total Ion Mapping) can be uploaded using mzXML or mzML. The uploaded data can review in GRITS Toolbox:
- list all uploaded file and associated meta data. Files can also be saved back to the file system.
- view MS spectra
- browse and traverse the MS scan list if the experiment consists of more than one MS scan
Annotation of glycomics MS data
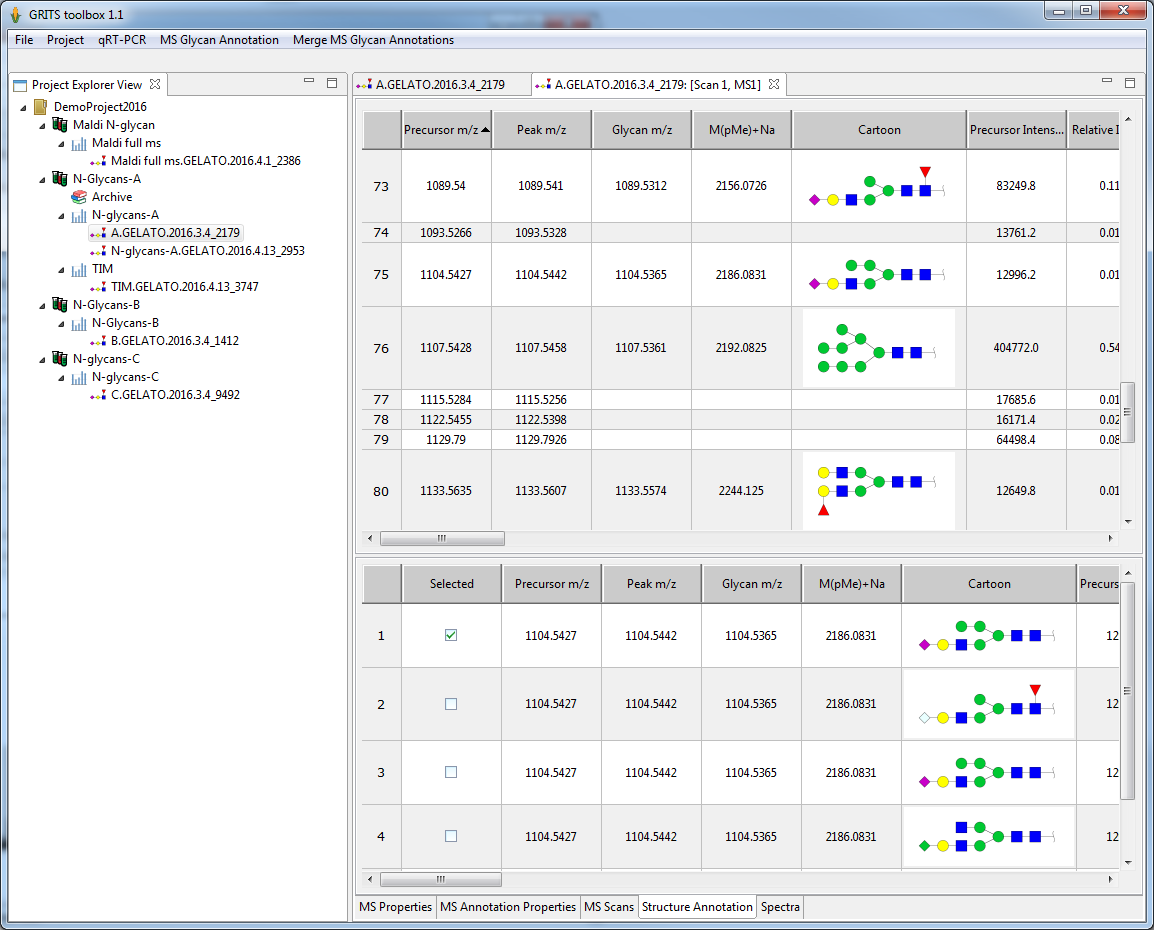
Glycomics MS data can be automatically annotated using the integrated annotation module (GELATO). Annotated data can than be displayed and reviewed by the user:
- each precursor peak (or MS peak for MS profiling) will be annotated with a set of structures matching the m/z
- users can select the right structures from the candidate set
- a large diversity of complimentary information is provided with each annotation to support users in choosing the right candidate
The annotation table can also be exported to Excel allowing for external data processing and data analysis.
Graphical glycan representation
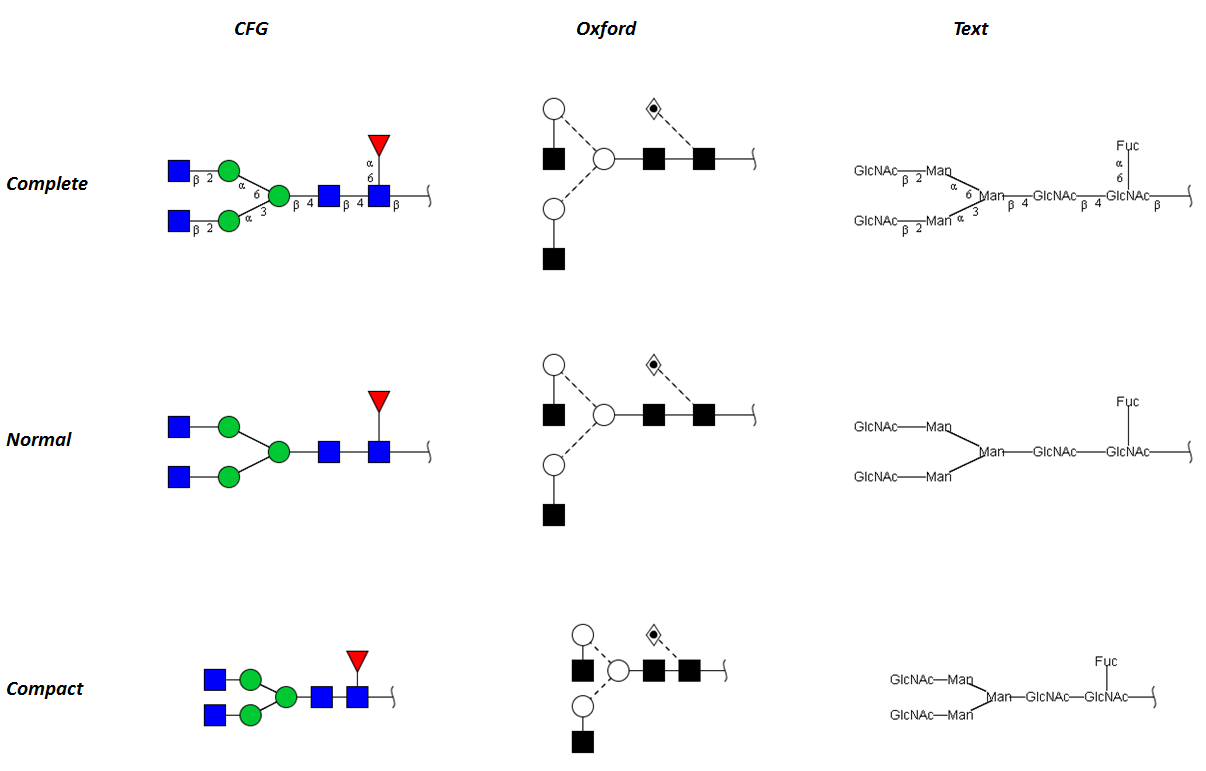
GRITS Toolbox supports several different glycan representations allowing users to choose their favored way of displaying glycans:
- cartoon representation according to the “Essentials of GlycoBiology“
- cartoon representation developed by the Oxford Glycoscience group
- textual representation similar to the recommendation developed by the IUPAC
Annotation of MSn data
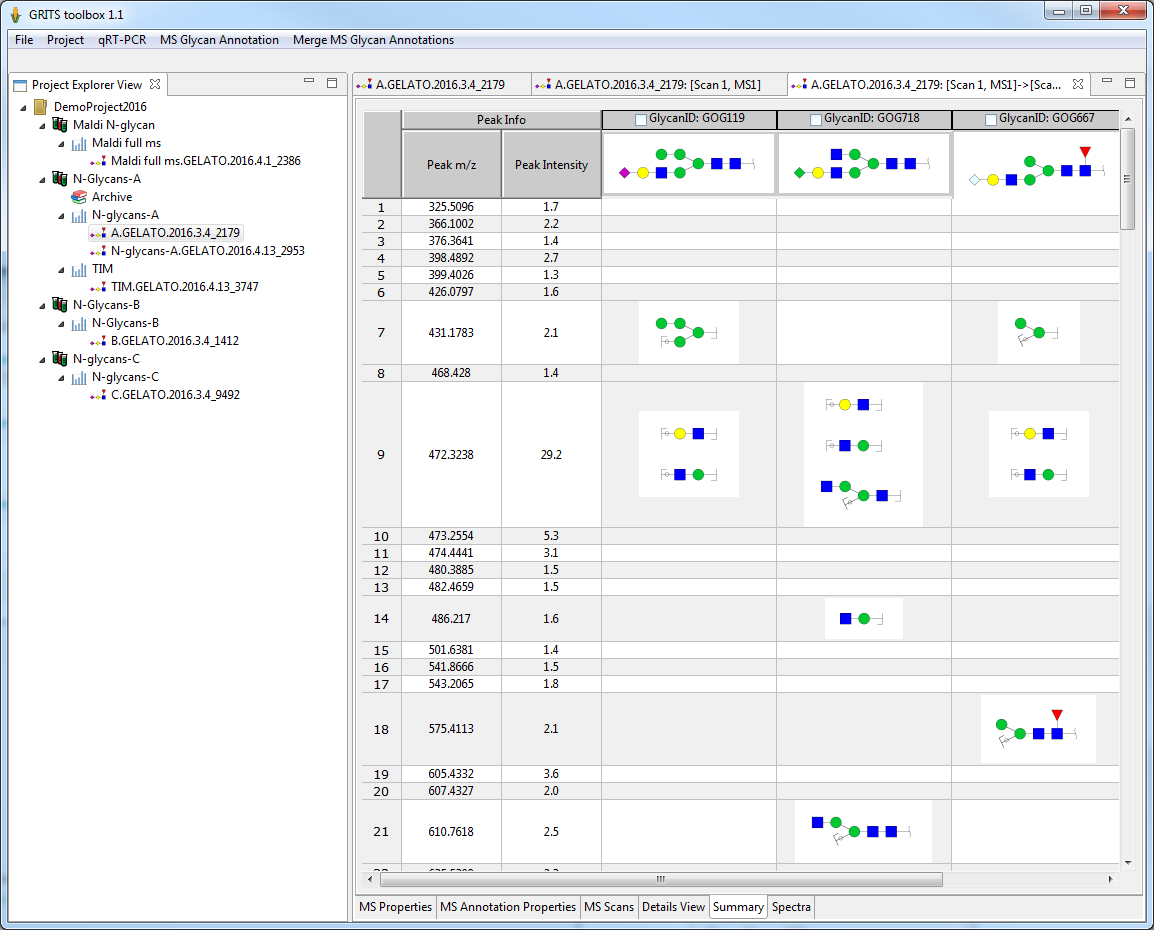
GRITS Toolbox allows the visualization of MSn data by comparing candidate structures and their fragments side by side:
- all possible fragmentation annoation of a candidate structure for a MSn spectra are shown
- users can select the right structures from the candidate set
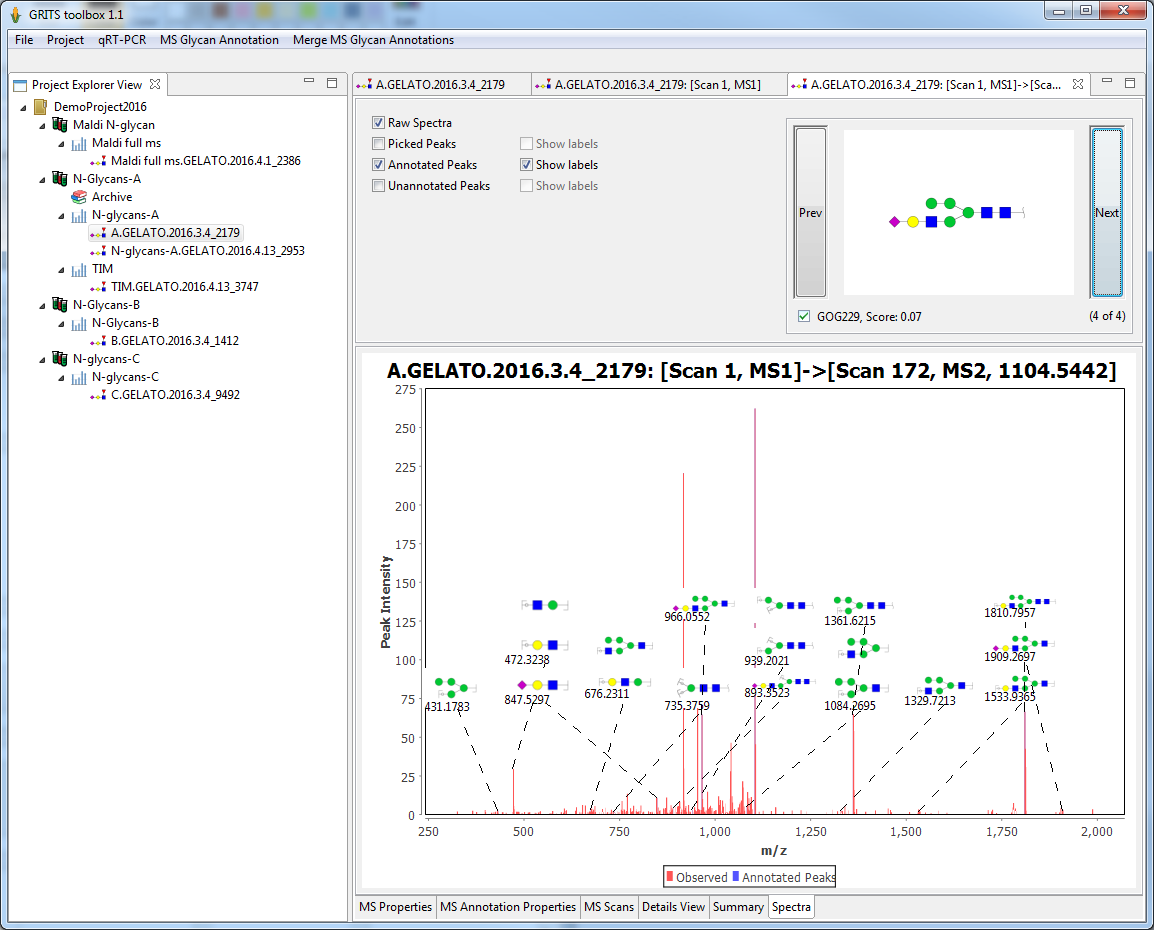
Graphical annotation of MS spectra
Structure annotations or fragment annotation can be rendered on top of a MS spectra plot to allow visual inspection of the annotation:
- controls on top of the plot allow customizing the display
- for MSn annotation users can scroll through the candidates and see how annotation changes with each candidate
- selection of the right candidate can be changed
Comparing annotations from different samples
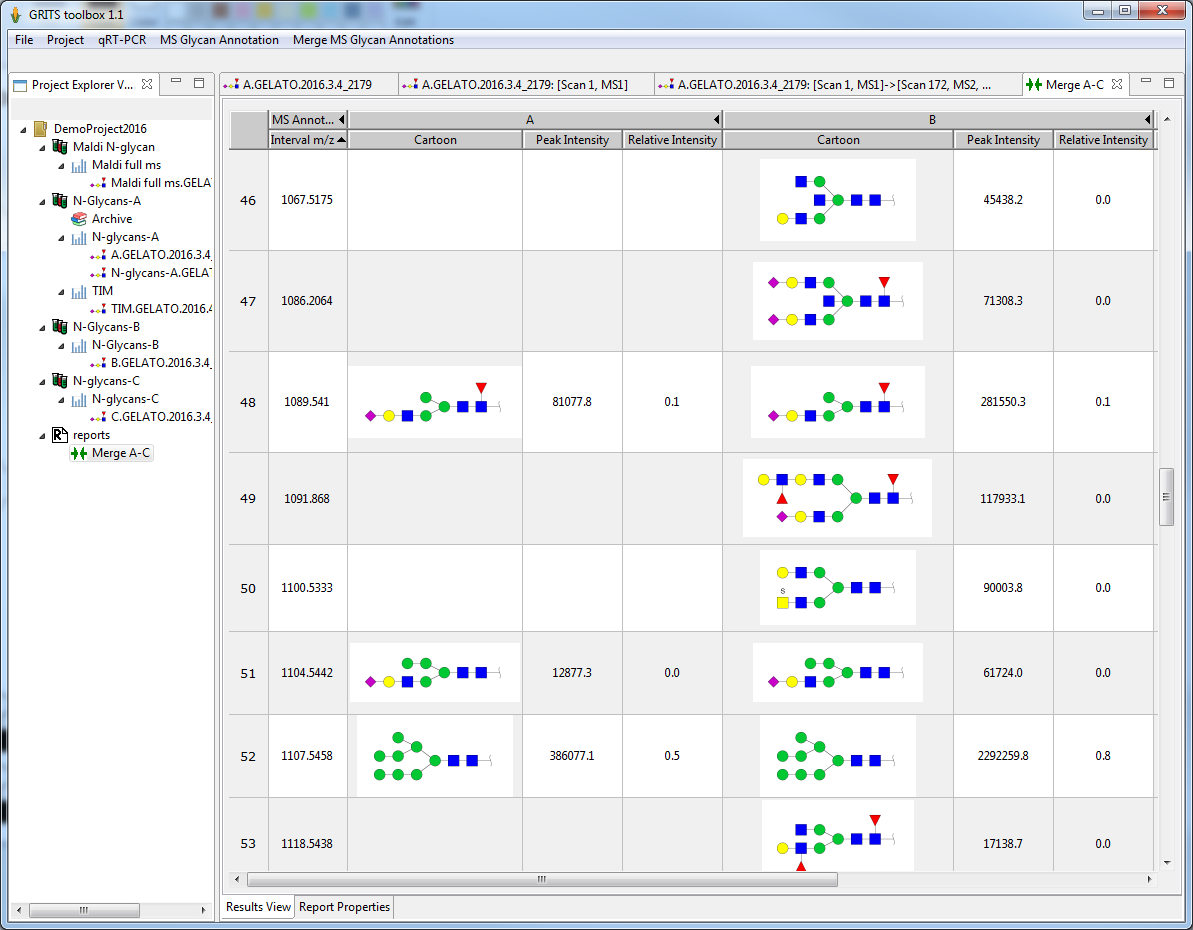
Finally, annotations from different samples can be shown side by side to allow studying changes in glycosylation of the different samples:
- for each sample the user selected annotation are shown
- annotations are aligned based on their m/z value
- additional information (for example: intensity, relative intensity, intensity towards a standard etc.) can be added to the report
The report can be exported to Excel for further data processing and data analysis.
